Watershed Programs
Each year the Clackamas River Water Providers implement a number of on going programs and individual projects that benefit the watershed and promote source water protection efforts. Below is a description of some of the work we have completed. For a more detailed look at what we accomplished this past year check out our Annual Report! CRWP Annual Report FY 2022-23

Find a Sign Near You!
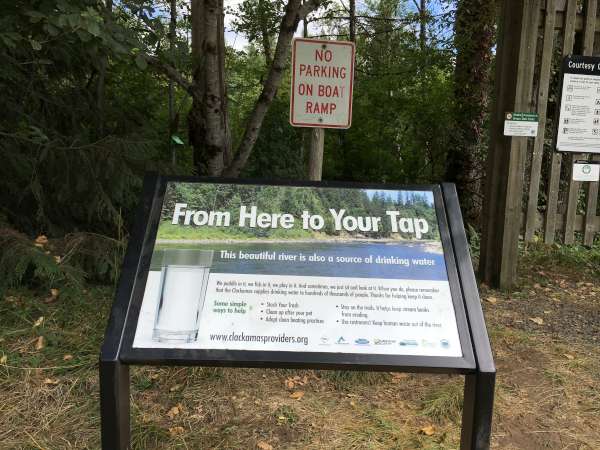
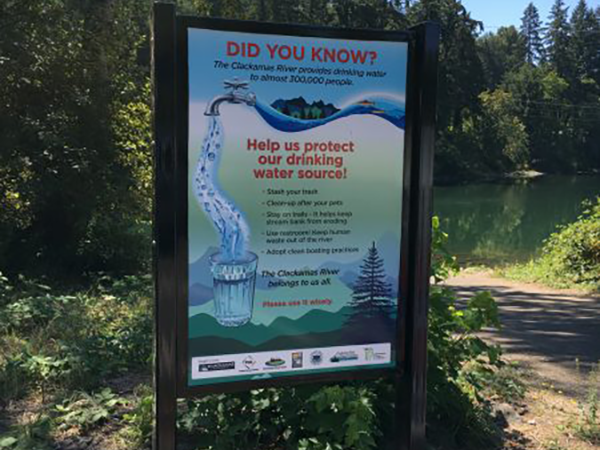
In 2014 the CRWP received a State Revolving Fund Drinking Water Protection Grant to install attractive interpretative signage at parks and boat ramps in the lower Clackamas River to help educate our river users on how their actions can impact water quality and what they can do to project our drinking water source. Due to the diverse ownership of parks and boat access points in the Clackamas River watershed the CRWP had to work with Oregon City Parks, Clackamas County Parks, Clackamas River Water (District), Oregon State Parks, and PGE on this project. Through this grant the signs were produced and installed at Riverside Park, Barton Park, and Milo McIver State Park in the lower river, and smaller version of the signs were installed by PGE at Timber Park, Promontory Park and along new river access point higher up in the watershed. As part of this grant the CRWP also worked with PGE and the Oregon State Marine Board to to get PGE’s renewly revamped Promontory Park marina certified under the Oregon Clean Marina Program. Certifiction was finalized in July of 2016 and acknowledgement of this accomplishment is listed on the Oregon State Marine Board website. To learn more about how you can paddle, fish, and play in the Clackamas while protecting our drinking water source click here.

Milo McIver State Park

Riverside Park
GIS Assessment of Drinking Water Threats
Between 2012 and 2105 the CRWP hired a contractor to complete a series of geographic information system (GIS) analyses in order to help to identify potential pathways for pollutants to enter into the Clackamas River. The goal of these GIS analyses was to map risk factors known to have a strong negative correlation with drinking water quality in the Clackamas River watershed. These mapped risks identified “hot spots” and provided a spatial context for both the geography and intensity of risk by activity that has been used by the CRWP to help prioritize mitigation efforts. In 2021 these risk analyses were updated. Click on the links below to see the Final Report for each analysis.
Septic Systems Risk Analysis Results 2021
Agriculture Risk Analysis Results 2021
Forestry Risk Analysis Results 2021
Urban Development Risk Analysis Results 2021
Point Source Pollutant Risk Analysis Results 2021
Hazardous Materials Risk Analysis Results 2021
Vulnerable Soils Risk Analysis Results 2021
Pollutant Load Modeling
In 2014 the CRWP hired Geosyntec to better understand the relative and cumulative impacts of land use in the watershed on drinking water source quality. To conduct this assessment a pollutant load modeling tool (PLMT, or the “tool”) was developed to assess baseline conditions and consider scenarios for management and risk reduction.
In 2022, the tool was updated to reflect current watershed conditions, address the identified water quality concerns, and upgrade the user interface to a web-based platform with an interactive map.
The updated PLMT is designed to assist CRWP with:
- prioritizing future water quality sampling to assess progress or performance
- selecting best management practices (BMPs) for mitigating various land use-based threats to source water quality, and
- prioritizing funding to obtain the greatest benefit out of CRWP’s available resources.
The PLMT utilizes land use and imperviousness geospatial data, characteristic land use pollutant runoff concentrations derived from literature sources, and average annual runoff coefficients based on U.S. EPA Storm Water Management Model (SWMM) continuous simulations. The tool allows the CRWP to simulate watershed development and stormwater quality improvement project scenarios, generate output graphics, and compare scenario results. The web tool consists of an interactive map, layer manager, user input form, and result viewer. There are 13 pollutants included in the model and 20 Best Management Practices (BMPs). To access the tool go to https://crwp-pollutant-load-model.azurewebsites.net/#
![]()
Our Source
![]()
Drinking-Water Protection
![]()
Watershed Protection
![]()
Water Quality
![]()
